Last update: Nov 2026

Cost of Living Comparison Between San Jose and Quincy, MA

For one person, living is cheaper in San Jose: $2,107 a month against $4,172 in Quincy, MA, rent and utilities included – about $24,800 less a year. Rent and utilities account for most of the difference.

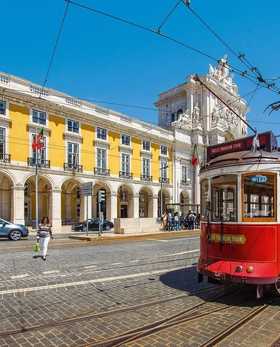
San Jose, Costa Rica
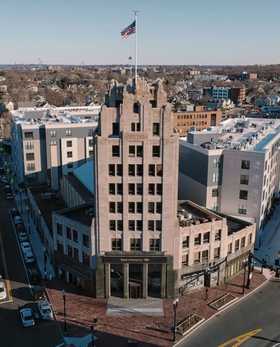
Quincy, MA, United States
San Jose
🇨🇷 Costa Rica
$2,107
/mo nomad
Quincy, MA
🇺🇸 United States
$4,172
/mo nomad
Monthly Cost of Living

How much you'll spend in San Jose and in Quincy, MA

Real prices from locals and on-the-ground checks – rent, groceries, transit and the daily extras. Here's what a month in San Jose and in Quincy, MA actually costs, broken down by who's living it.

A single person spends $2,107 per month in San Jose vs $4,172 in Quincy, MA, rent included.

  • San Jose $2,107
  • Quincy, MA $4,172

A couple spends around $3,081 per month in San Jose vs $5,775 in Quincy, MA, rent included.

  • San Jose $3,081
  • Quincy, MA $5,775

A family of three spends $4,054 per month in San Jose vs $7,379 in Quincy, MA, rent included.

  • San Jose $4,054
  • Quincy, MA $7,379

San Jose is about 49% cheaper than Quincy, MA, and outside of rent the biggest gap is in eating out.

Both San Jose and Quincy, MA sit above the global median – San Jose by 56%, Quincy, MA by 209%.

Currency
🍽 Eating Out
San Jose
Quincy, MA
Difference
Meal at Budget Restaurant
$12.37 ₡5,563
$29.67 $29.67
-58.31%
Three-Course Dinner for Two, Mid-Range
$62.4 ₡28.0K
$118 $118
-47.28%
Fast Food Meal (McDonalds, etc)
$11.71 ₡5,264
$12.10 $12.10
-3.22%
Cappuccino
$4.54 ₡2,040
$5.23 $5.23
-13.19%
Coke/Pepsi/Fanta/Sprite (0.33 liter bottle)
$2.75 ₡1,238
$2.93 $2.93
-6.14%
Water (0.33 liter bottle)
$1.86 ₡837
$2.53 $2.53
-26.48%
Local Beer (0.5 liter draught)
$3.35 ₡1,505
$6.79 $6.79
-50.66%
Imported Beer (0.33 liter bottle)
$4.32 ₡1,944
$7.83 $7.83
-44.83%
🛒 Groceries & Markets
San Jose
Quincy, MA
Difference
Milk (1 liter)
$2.36 ₡1,061
$1.26 $1.26
87.30%
White Bread (500g)
$3.07 ₡1,379
$3.87 $3.87
-20.67%
Rice (white) (1kg)
$2.51 ₡1,128
$5.45 $5.45
-53.94%
Eggs
$3.53 ₡1,585
$4.89 $4.89
-27.81%
Local Cheese (1kg)
$10.54 ₡4,738
$11.08 $11.08
-4.87%
Chicken Fillets (1kg)
$10.57 ₡4,754
$14.26 $14.26
-25.88%
Beef Round Steak (1kg)
$13.92 ₡6,261
$17.97 $17.97
-22.54%
Apples (1kg)
$5.20 ₡2,338
$6.90 $6.90
-24.64%
Banana (1kg)
$1.65 ₡740
$2.09 $2.09
-21.05%
Oranges (1kg)
$4.89 ₡2,198
$6.61 $6.61
-26.02%
Tomato (1kg)
$3.84 ₡1,728
$6.58 $6.58
-41.64%
Potato (1kg)
$3.91 ₡1,757
$3.54 $3.54
10.45%
Onion (1kg)
$3.76 ₡1,692
$3.97 $3.97
-5.29%
Lettuce (1 head)
$1.12 ₡504
$2.64 $2.64
-57.58%
Water (1.5 liter bottle)
$3.22 ₡1,447
$1.57 $1.57
105.10%
Cigarettes 20 Pack (Marlboro, Camel)
$6.02 ₡2,706
$13.13 $13.13
-54.15%
Wine (Bottle)
$19.84 ₡8,919
$13.96 $13.96
42.12%
Local Beer (0.5 liter bottle)
$2.81 ₡1,264
$2.07 $2.07
35.75%
Imported Beer (0.33 liter bottle)
$3.65 ₡1,643
$3.92 $3.92
-6.89%
🚌 Getting Around
San Jose
Quincy, MA
Difference
One-way Ticket (Public Transport)
$1.08 ₡487
$2.39 $2.39
-54.81%
Public Transport Monthly Pass (Regular Price)
$65.2 ₡29.3K
$109 $109
-40.17%
Taxi Start (Normal Tariff)
$2.26 ₡1,018
$4.05 $4.05
-44.20%
Taxi (Normal Tariff) (1km)
$1.78 ₡799
$1.79 $1.79
-0.56%
Taxi 1hour Waiting (Normal Tariff)
$7.90 ₡3,551
$28.37 $28.37
-72.15%
Gasoline (1 liter)
$1.50 ₡673
$1.14 $1.14
31.58%
Midsize Hatchback 1.4l (Volkswagen Golf, Toyota Prius, Honda Civic, etc)
$33.5K ₡15.1M
$27.5K $27.5K
21.75%
Compact Sedan 1.6l (Toyota Corolla, Mazda3, Kia K4, Hyundai Elantra, etc)
$42.3K ₡19.0M
$26.8K $26.8K
58.04%
🧾 Monthly Utilities & Internet
San Jose
Quincy, MA
Difference
Utilities for 2 People in 2-bedroom Apartment (Heating, Electricity, Gas, Water, Garbage) (85m2)
$93.2 ₡41.9K
$242 $242
-61.42%
SIM Card Monthly Plan (Calls and 10GB+ Data)
$36.13 ₡16.2K
$56.9 $56.9
-36.50%
Internet (50+ Mbps, Unlimited Data)
$60.6 ₡27.2K
$80.2 $80.2
-24.46%
🎉 Sport & Entertainment
San Jose
Quincy, MA
Difference
Gym Membership (Monthly)
$68.9 ₡31.0K
$79.3 $79.3
-13.09%
Tennis Court (1 Hour on Weekend)
$24.94 ₡11.2K
$50.4 $50.4
-50.49%
Cinema Ticket
$7.67 ₡3,449
$15.19 $15.19
-49.51%
🧸 Childcare & Education
San Jose
Quincy, MA
Difference
Preschool or Kindergarten, Full Day, Private, 1 Child (Monthly)
$972 ₡436.9K
$1,808 $1,808
-46.27%
International Primary School, 1 Child (Yearly)
$18.9K ₡8.5M
$44.5K $44.5K
-57.56%
👕👟 Clothing & Footwear
San Jose
Quincy, MA
Difference
Jeans (Levis 501 Or Similar)
$70.6 ₡31.8K
$64.1 $64.1
10.22%
Summer Dress (H&M, Zara, etc)
$56.7 ₡25.5K
$38.57 $38.57
46.95%
Sport Shoes (Adidas, Nike)
$129 ₡57.8K
$100.0 $100.0
28.68%
Men's Leather Business Shoes
$131 ₡58.8K
$102 $102
28.79%
🏠 Accommodation & Living
San Jose
Quincy, MA
Difference
1-bedroom Apartment, City Center (Monthly)
$1,170 ₡525.9K
$3,126 $3,126
-62.59%
1-bedroom Apartment, Outside City Center (Monthly)
$943 ₡424.1K
$2,556 $2,556
-63.09%
3-bedroom Apartment, City Center (Monthly)
$1,984 ₡892.0K
$4,514 $4,514
-56.05%
3-bedroom Apartment, Outside City Center (Monthly)
$1,400 ₡629.5K
$3,622 $3,622
-61.34%
Buy Apartment in City Center (m2)
$2,681 ₡1.2M
$3,261 $3,261
-17.79%
Buy Apartment Outside City Center (m2)
$2,037 ₡915.8K
$1,247 $1,247
63.38%
💵 Salaries & Financials
San Jose
Quincy, MA
Difference
Average Monthly Net Salary (After Tax)
$987 ₡443.6K
$5,950 $5,950
-83.42%
20-Year Fixed Mortgage Interest Rate (Annual %)
8.62
6.64
29.82%

CityCost data is based on AI and user input – minor inaccuracies may occur.

Last update for San Jose: November 2, 2026

Last update for Quincy, MA: November 1, 2026

Monthly budget structure
Share of the monthly basket for one person, rent included.
Accommodation & Living
San Jose
$943
Quincy, MA
$2.6K 171% $1.6K
Groceries & Markets
San Jose
$403
Quincy, MA
$452 12.1% $49
Eating Out
San Jose
$232
Quincy, MA
$408 75.5% $176
Monthly Utilities & Internet
San Jose
$190
Quincy, MA
$379 99.4% $189
Clothing & Footwear
San Jose
$174
Quincy, MA
$137 21.4% $37
Sport & Entertainment
San Jose
$84
Quincy, MA
$110 30.2% $25
Getting Around
San Jose
$81
Quincy, MA
$132 63% $51

Cost Breakdown

A central one-bedroom costs $1,170 in San Jose versus $3,126 in Quincy, MA. Rent is usually the largest line item in a monthly budget, so the gap here sets the tone for the overall comparison.

Salaries in Quincy, MA are about 6 times higher. Purchasing power depends on which expenses matter most to you.

A mid-range dinner for two costs $62 in San Jose versus $118 in Quincy, MA. Monthly groceries follow the same trend: $403 vs $452 – making San Jose the more affordable choice for daily food spending.

Good to know
🇨🇷 San Jose
🇺🇸 Quincy, MA
🕒 Local time
11:41 11:41 AM
12:41 12:41 PM
1 h ahead of San Jose
🌤 Weather
👥 Population
342,188 Capital
92,271
Exchange rates and currency converter

USD, EUR to CRC – Costa Rican Colón Converter

Costa Rican Colón exchange rates as of November 6, 2026: 1 USD = 450 CRC (1,000 CRC = 2.22 USD). 1 EUR = 505 CRC (1,000 CRC = 1.98 EUR).

United States Dollar exchange rates as of November 6, 2026: 1 EUR = 1.12 USD (1 USD = 0.89 EUR).

On the map
Between locations
  • San Jose Quincy, MA 3,810 km ≈ 5 h nonstop flight
From you
  • San Jose
  • Quincy, MA

Distances are measured in a straight line. Your location is detected approximately.

City Median Internet Speeds Comparison (Updated April 2026)

The chart highlights the Precision Threshold for mobile and fixed broadband internet speeds, updated quarterly.
Digital Nomad Cost of Living Index
San Jose vs Quincy, MA: Cost of Living - Frequently Asked Questions
Is San Jose cheaper than Quincy, MA?
Yes – Quincy, MA is pricier by about 98%, and outside of rent the gap shows up most in eating out.
What income do you need for each city?
For a comfortable life, plan on about $3,161 per month in San Jose and $6,258 in Quincy, MA. That covers rent, food, utilities, transport, and enough left over to feel settled – not just surviving.
Which city has lower housing costs?
Rent is clearly cheaper in San Jose, especially for central apartments: a one-bedroom in the center costs $1,170 there versus $3,126 in Quincy, MA.
What are total monthly expenses in San Jose and in Quincy, MA?
Monthly expenses with rent come to $2,107 in San Jose and $4,172 in Quincy, MA. That makes San Jose about 49% cheaper.
Which city has cheaper public transport?
Public transport costs about 40% less in San Jose. For daily commuters, that gap adds up to noticeable savings over a year.
Is $2,500 a realistic budget for living in San Jose or in Quincy, MA?
A $2,500 monthly budget goes further in San Jose, where all-in costs run around $2,107, than in Quincy, MA at $4,172. In San Jose it covers expenses comfortably, while in Quincy, MA it requires careful planning or may not stretch far enough.
Is San Jose or Quincy, MA more family-friendly?
Families tend to lean toward San Jose – lower housing and cheaper childcare make a real difference, especially on a single income or when paying for private education.
Which city is the better choice to relocate to?
If budget matters most, go with San Jose. If higher salaries or specific career opportunities are the priority, Quincy, MA makes more sense. Both are solid long-term options with distinct trade-offs.

San Jose vs other spots: cost of living compared

Similar cities

Show times on the 12-hour clock, temperatures in °F and distances in miles?